
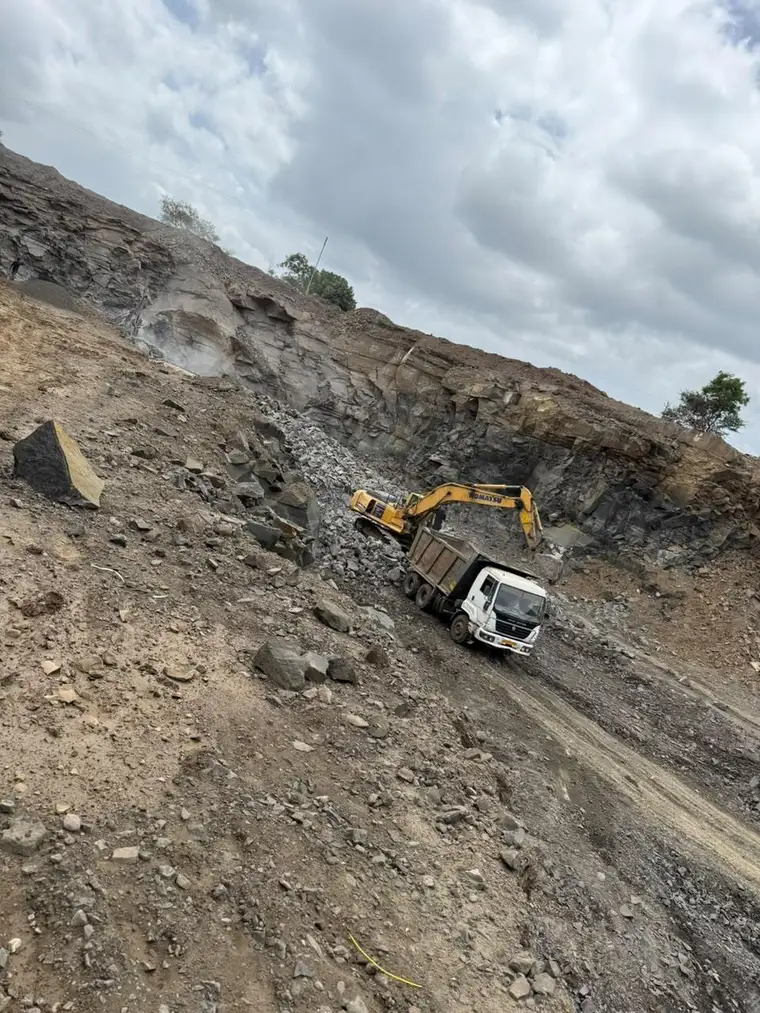
In short
- Cut is material excavated below existing ground and fill is material placed above it. Borrow is fill brought from outside the cut, and spoil is cut that leaves the job.
- Volumes between cross-sections come from the average-end-area method: the mean of the two areas times the distance between them.
- Bank, loose and compacted volumes are three different numbers. Well-blasted hard rock typically swells by 50 to 70% when dug, so count tipper loads in loose cubic metres.
- A mass haul diagram plots cumulative volume against chainage. A rising curve is cut, a falling curve is fill, and a horizontal line across it marks a stretch that balances.
- Not all cut is fill. MoRTH Section 305 rules out highly plastic and expansive clays, soils of low density and oversize stone.
A highway alignment rarely follows the ground. Where the design level is below the ground the road is in cut, where it is above the road is on fill, and the earthwork planner's job is to move the first into the second with the least haulage.
Balanced earthwork means the usable cut along a stretch roughly equals the fill it needs, after allowing for how the material changes volume. The tool for seeing it is the mass haul diagram: cumulative volume plotted against chainage. It shows where the material goes, how far, and where a borrow pit or spoil dump will be needed.
Cut, fill, borrow and spoil
Cut and fill are defined by the formation level. The other two words are where the money goes. Borrow is fill brought from a pit outside the roadway because the cut cannot supply it, in quantity or in quality. Spoil is cut that leaves for a dump because it is surplus or unsuitable.
A cubic metre of unsuitable cut is loaded and hauled to a dump, and then a cubic metre of borrow is dug, loaded and hauled in to do the job it could not. Two loadings, two hauls, and often a royalty on the borrow. A stretch that balances pays for one.
Volumes by average end area
Earthwork volume is calculated from cross-sections taken at regular chainages. For each pair of sections, the average-end-area method multiplies the mean of the two areas by the distance between them: V = (A1 + A2) / 2 x L.
Bank, loose and compacted volumes
Soil and rock do not keep their volume when moved. In the ground it is a bank cubic metre, which is what the cross-sections measure. Dug and dropped into a tipper it bulks up to a loose cubic metre, which is what the fleet carries. Rolled into an embankment it closes up to a compacted cubic metre, which is what the fill is measured in. Swell is the increase from bank to loose. Shrinkage is the decrease from bank to compacted that most soils show.
For blasted rock the change is large. As a starting point, well-blasted hard rock swells by about 50 to 70%, with 60 to 65% typical, so 1,000 bank m3 of rock cut becomes roughly 1,600 loose m3 at the tipper. A trial on the actual shot decides the real figure.
For soil we would not print a shrinkage factor at all. It depends on the soil, its density in the bank and the 95 or 97% it is compacted to. The honest way to get it is to compare the bank density in the cut with the field density in the first layers of fill.
Reading a mass haul diagram
Convert the fill volumes to the bank volume needed to build them, call cut positive and fill negative, and add them up along the alignment. Plot the running total against chainage and you have the mass haul curve.
| Chainage | Cut (m3) | Fill (m3) | Cumulative (m3) |
|---|---|---|---|
| 0+000 to 0+100 | 4,000 | 0 | +4,000 |
| 0+100 to 0+200 | 2,500 | 0 | +6,500 |
| 0+200 to 0+300 | 0 | 3,000 | +3,500 |
| 0+300 to 0+400 | 0 | 3,500 | 0 |
| 0+400 to 0+500 | 0 | 2,000 | -2,000 |
Fill is shown as the bank volume needed to build it.
- A rising curve is cut and a falling curve is fill.
- A peak is where cut changes to fill, and a trough is where fill changes to cut. In the table the peak is at 0+200.
- Any horizontal line that meets the curve twice is a balance line: between the two points, cut equals fill. Here the zero line balances 0+000 to 0+400, where 6,500 m3 of cut builds 6,500 m3 of embankment.
- Where the curve ends below the line, the shortfall is borrow. Above it, the surplus is spoil. This stretch is 2,000 m3 short.
Free haul and overhaul
Most contracts include haulage up to a stated distance in the excavation rate. That distance is the free haul, the initial lead of many Indian bills of quantities. Material carried further is overhaul, measured as volume times the extra distance and paid, if it is paid at all, as a separate item. On the diagram, a horizontal chord inside a loop, as long as the free haul distance, separates the two: the volume between the chord and the peak moves free, the rest on overhaul.
The distance is a contract figure and differs from one agreement to the next, so read the lead clause before pricing. Lead distance does the same thing to a delivered aggregate rate, for the same reason.
When cut cannot be used as fill
A balance on paper assumes the cut is fit to place. MoRTH Section 305 says otherwise for several materials, and each one turns planned fill into spoil plus borrow.
- Clay with a liquid limit over 50 and a plasticity index over 25 is unsuitable (Clause 305.2.1.1).
- Soil with a free swelling index above 50% (IS 2720 Part 40) is not used as fill.
- Soil whose laboratory maximum dry density is under the Table 300-1 minimum for that part of the road, which runs from 15.2 kN/m3 for embankment up to 3 m high to 17.5 kN/m3 for sub-grade.
- Oversize. Particles are limited to 75 mm in embankment and 50 mm in sub-grade, and never more than two-thirds of the compacted layer thickness, so blasted rock cannot go into an earth embankment as it falls.
Test the cut early. The compaction limits for embankment and sub-grade apply to whatever goes in, and learning in month four that the big cut is expansive clay rewrites the diagram. Specifications are revised, so confirm the limits in the edition your contract names.
How haul distance decides the fleet
The diagram gives volumes and distances, and the fleet follows. Short hauls inside one loop need few tippers per excavator. Overhaul and borrow leads need more, and the usual starting point is trucks = truck cycle time divided by loading time, rounded to a whole number. Too few and the excavator waits. Too many and the tippers queue.
Cycle time is mostly the haul road. A rutted, soft road can carry several times the rolling resistance of a firm, watered one, and the cycle stretches with it. This is where our earthwork and haulage crews spend effort early: 20 excavators and 55 tippers, all owned, are only as productive as the road between the cut and the fill. Working out tipper numbers from cycle time takes the arithmetic further.
Standards and sources
- MoRTH Specifications for Road and Bridge Works, Fifth Revision (2013), Section 305: Clause 305.2.1.1 and Table 300-1
- IS 2720 (Part 40), free swell index of soils
- Swell of blasted rock: published highway-agency earthwork tables, used as a starting point only
- Rolling resistance and truck matching: equipment manufacturers' published guidance, used as rules of thumb
- Excavator and tipper figures: SM Infra's own operating record
Your contract and its technical schedules override anything written here. Check the clause before you build to it.